Covenant Assessment of a Defence Reset – Treasury impact
(10% p.a. Force Regeneration Model vs %-of-GDP Model)


4
1. First Principle (Treasury-Critical)
Defence spending is not consumption.
It is national risk insurance with domestic economic multipliers.
Treasury currently treats Defence largely as:
- Discretionary expenditure
- Competing with health, welfare, education
Under the Covenant reset, Defence is reframed as:
- Risk-reduction investment
- Industrial stabiliser
- Labour force and skills engine
That reframing is what allows assessment.
2. Baseline (Simplified, Order-of-Magnitude)
To reason cleanly, Treasury would start with approximate baselines:
- Current UK defence budget: ~£55–60bn p.a.
- Regular + reserve forces: ~200,000–220,000
- Defence industrial employment (direct + indirect): ~400,000+
We do not need precision to assess directionality.
3. What “10% p.a. Growth” Actually Means (Treasury View)
Important correction:
10% growth in force capacity ≠ 10% growth in budget.
Because:
- Not all costs scale linearly
- Capital, training, infrastructure, and industrial utilisation behave differently
Treasury Decomposition
| Cost Component | Scaling Behaviour |
|---|---|
| Personnel pay | ~Linear |
| Training pipelines | Sub-linear after setup |
| Equipment | Lumpy, amortised |
| Infrastructure | Front-loaded |
| Industry overheads | Strong economies of scale |
👉 Result: early years are more expensive; later years are more efficient.
4. Indicative Fiscal Path (Illustrative, Not a Promise)
A Treasury-credible envelope might look like:
| Year | Force Growth | Defence Spend Growth | Commentary |
|---|---|---|---|
| 1–2 | +10% p.a. | +6–8% p.a. | Training, recruitment, setup |
| 3–5 | +10% p.a. | +4–6% p.a. | Industrial scaling stabilises |
| 6–10 | +10% p.a. | +3–4% p.a. | Economies of scale dominate |
This breaks the false equivalence between force growth and runaway cost.
5. Treasury Paybacks (Normally Ignored)
5.1 Tax Recapture
Defence spending has high domestic retention:
- PAYE & NI from personnel
- Corporation tax from suppliers
- VAT through supply chains
Typical recapture estimates (conservative):
- 30–40% of spend returns directly to Treasury
So a £5bn uplift may have a net fiscal cost closer to £3bn.
5.2 Welfare Offset
Every additional service member:
- Is not unemployed
- Is not economically inactive
- Is not long-term welfare-dependent
This is silent Treasury benefit, rarely modelled.
5.3 Industrial Stability Dividend
Stable defence demand:
- Reduces insolvencies
- Preserves skills
- Lowers future reconstitution costs
Treasury normally pays far more rebuilding capacity after neglect than sustaining it continuously.
6. Risk-Adjusted Treasury Logic (The Missing Model)
Treasury today implicitly assumes:
“Major war is low probability → under-invest”
The Covenant forces Treasury to confront:
Probability × Consequence × Irreversibility
From a Treasury standpoint:
- A 2–5% probability of catastrophic conflict
- With multi-trillion-pound downside
- Justifies single-digit billions annually in insurance spend
That is rational actuarial logic, not hawkishness.
7. Why GDP % Is Treasury-Lazy (and Dangerous)
| GDP % Model | Force Regeneration Model |
|---|---|
| Politically convenient | Analytically defensible |
| Cyclical noise | Strategic signal |
| No outcome link | Direct readiness link |
| Encourages salami slicing | Encourages planning discipline |
Treasury prefers GDP % because it is easy to cap — not because it is sound.
8. Net Treasury Judgement (If Done Properly)
A serious Treasury assessment should conclude:
- The Defence reset is fiscally manageable
- Net cost is materially lower than headline spend
- Industrial and tax feedbacks are significant
- Risk-reduction value dwarfs annual cost
- Delay increases future fiscal exposure
Or put bluntly:
Treasury cannot afford not to do this — it would be simply deferring a much larger bill.
Modelling Armed Forces regeneration 10%pa
illustrative assumptions
This Covenant assessment does not represent an official HM Treasury, OBR, MOD, or NAO forecast. It draws on published defence spending baselines and publicly reported Armed Forces strength as starting points. A force regeneration rate of approximately 10% per annum is used illustratively and would, in practice, be governed by Multi-Criteria Decision Making rather than fixed targets. Forward defence spending paths and nominal GDP growth are scenario assumptions intended to demonstrate order-of-magnitude effects rather than precise forecasts. A 35% domestic “recapture” rate is applied to distinguish between headline expenditure and net fiscal impact; this parameter is explicit, adjustable, and included to make fiscal logic transparent and testable.
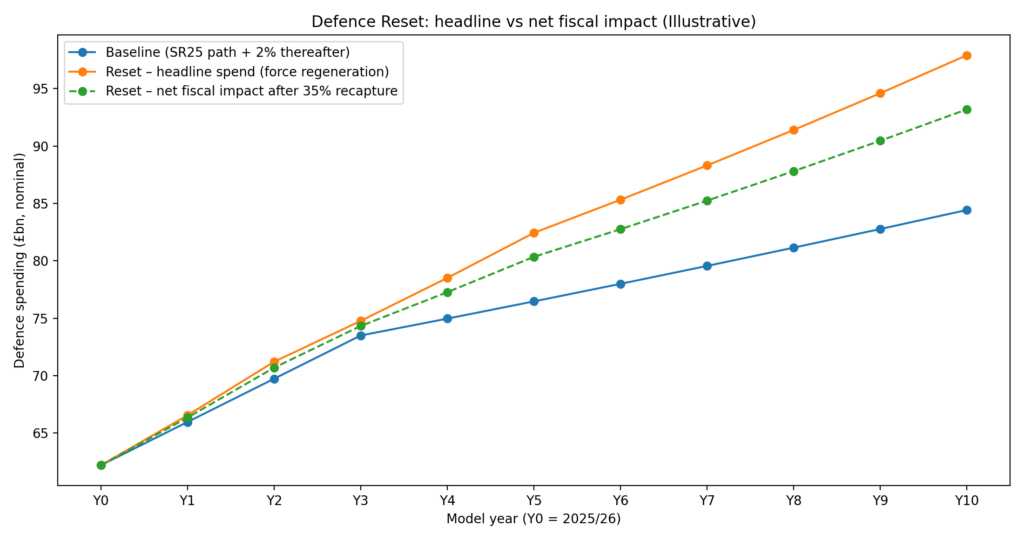
Defence reset spending path. The dashed orange line shows the net fiscal impact after an illustrative 35% recapture of defence expenditure through taxation and domestic economic activity. While headline spending rises under the reset, the net fiscal trajectory converges toward the baseline — delivering a fundamentally different strategic outcome (force regeneration) within a comparable fiscal envelope.
Why this matters to Treasury:
The dashed line represents the net fiscal impact of the defence reset after allowing for domestic recapture through taxation, employment, and supply-chain effects. While the headline defence budget rises under a force-regeneration strategy, the net cost to the Exchequer is materially lower and converges toward the baseline path over time. This demonstrates that Treasury’s true decision is not between “higher spending” and “affordability”, but between deploying a similar net fiscal envelope for radically different strategic outcomes — passive maintenance of declining capability versus active regeneration of national defence capacity and risk resilience.
| Force Strength Increase (10% p.a.) | Baseline defence spend (£bn) | Reset defence spend (£bn) | Gross incremental (£bn) | Net incremental after 35% recapture (£bn) | Baseline % GDP | Reset % GDP |
| 180,780 | 62 | 62 | 0.00 | 0.00 | 2.06 | 2.06 |
| 198,858 | 66 | 67 | 0.60 | 0.40 | 2.09 | 2.11 |
| 218,744 | 70 | 71 | 1.50 | 1.00 | 2.12 | 2.16 |
| 240,618 | 74 | 75 | 1.30 | 0.80 | 2.14 | 2.17 |
| 264,680 | 75 | 79 | 3.50 | 2.30 | 2.09 | 2.18 |
| 291,148 | 77 | 82 | 6.00 | 3.90 | 2.04 | 2.20 |
| 320,263 | 78 | 85 | 7.30 | 4.80 | 1.99 | 2.17 |
| 352,289 | 80 | 88 | 8.80 | 5.70 | 1.94 | 2.15 |
| 387,518 | 81 | 91 | 10.30 | 6.70 | 1.89 | 2.13 |
| 426,270 | 83 | 95 | 11.80 | 7.70 | 1.85 | 2.11 |
| 468,897 | 84 | 98 | 13.50 | 8.80 | 1.80 | 2.09 |